Yearly Solar Radiation
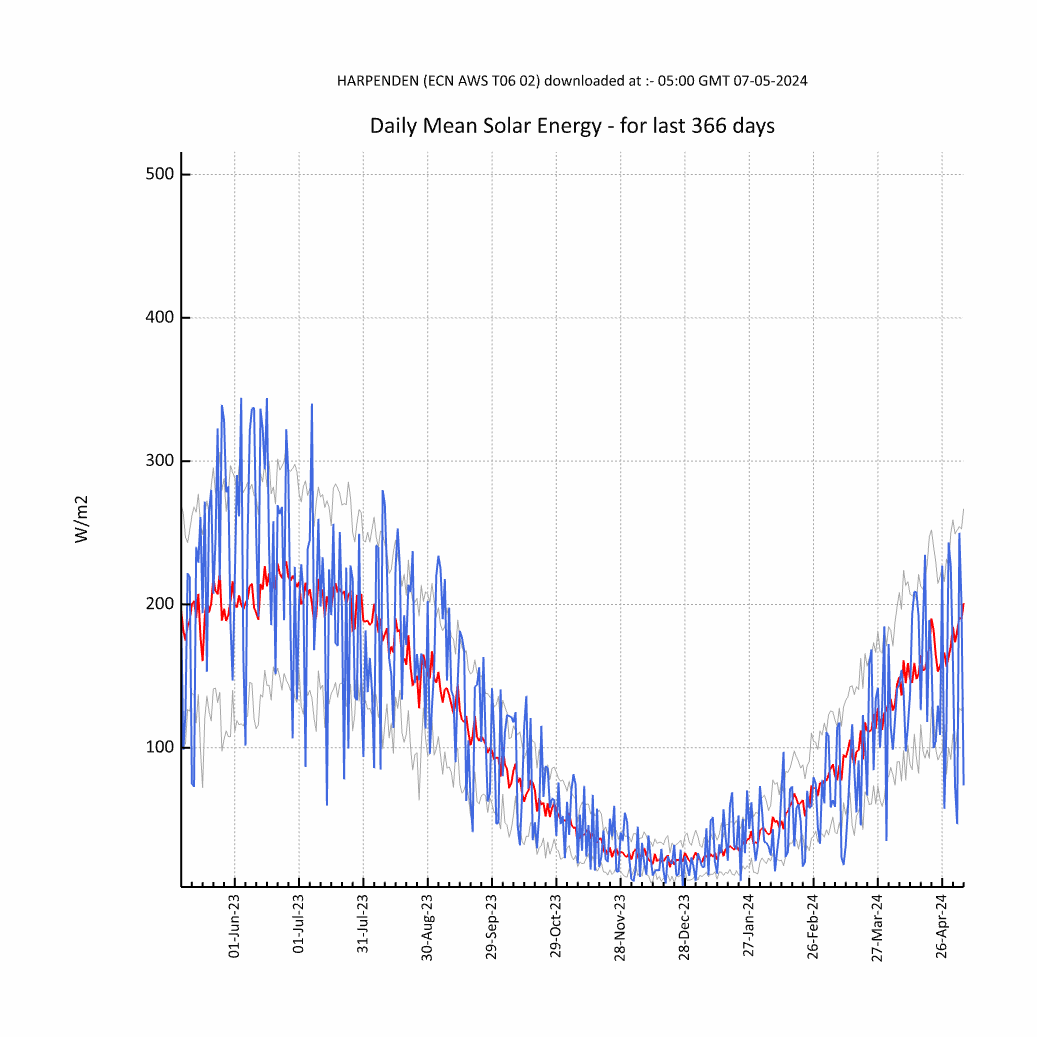
Blue Line : Mean Daily Values (00:00 to 24:00 GMT); Red Line : 30 year mean, 1981 to 2010 (previously 1971-2000); Grey Line : +/- one standard deviation representing the variability of the data used to calculate the thirty year mean.