Woburn Weather Charts
Real-Time Measurement of Climatic Variables
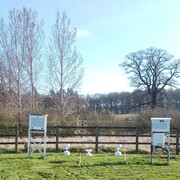
Woburn Met Station is located approximately 30 miles North of Rothamsted Research, Harpenden, Hertfordshire at its outreach experimental farm in Husborne Crawley, Woburn, Bedfordshire. Manual measurements of climatic variables started in 1928 and in 1999 the station was fully automated. As with Rothamsted the main change was replacing the standard five inch cylindrical rain gauge (Met Office type MK2) with a tipping bucket rain gauge with both aerodynamic and thermodynamic properties (type ARG100). Our current rain gauge is a SBS500 which replaced the ARG100 in September 2020, which again has both aerodynamic and thermodynamic properties. These properties mean that there is a higher rainfall capture due to a reduction in wind eddies, which can knock water away from the gauge, and loss of water through evaporation.
Please note at times of snowfall rainfall data will not be accurate and depending on rate of thaw may not be recorded on the day it occurred.
The meteorological data presented in the charts below can be obtained from the electronic Rothamsted Archive .
As well as this meteorological station and that at Harpenden. Rothamsted Research also has a meteorological station at its other outreach site Brooms Barn Research Station, Higham, Suffolk. Data for this site can be obtained through the electronic Rothamsted Archive.
Click on thumbnails in sections below to see charts (if charts are not up to date then press keys Ctrl and F5 together on keyboard to refresh cache).
The hourly mean or total is graphed (using Genstat 23rd Edition) showing weekly, monthly and yearly summaries. The yearly summary is graphed against the 30 year mean (1991-2020), based on measurements made at the Woburn Meteorological Station, with the variability of the mean being shown using +/- one standard deviation. These graphs are produced from the raw data and are subject to change after quality checks have been carried out.
Todays Weather
 Today's weather is observed hourly from 00:00 to 24:00 GMT
(to view table of current data click here)
Temperature (mean), degree Celsius (°C): last hour - red column (red value); previous hour - green pointer;
maximum for day - orange pointer; minimum for day - blue pointer.
Rainfall (total), millimetres (mm): hourly and total - blue column (blue value).
Wind Vectors (mean) - Wind Speed, metres/second (m/s) and Direction, degrees (°):
last hour - purple arrow (values within title text, also shows wind speed in miles per hour (mph) and knots (kts); previous hour - blue arrow
Air Temperature
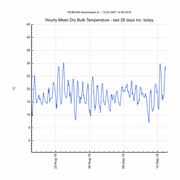 Monthly: Hourly mean air temperature, °C. (Blue line) .
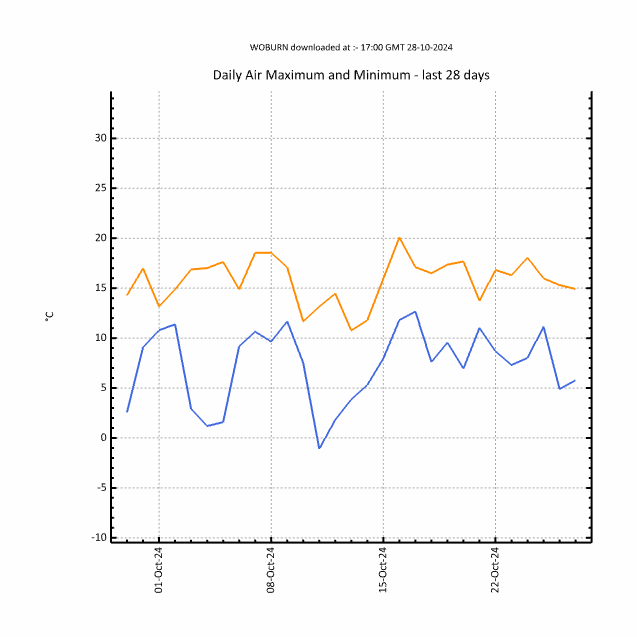 Monthly: Daily maximum air temperature (Orange line) and minimum air temperature (Blue line), °C, are based on hourly mean air temperatures (09:00 to 09:00).
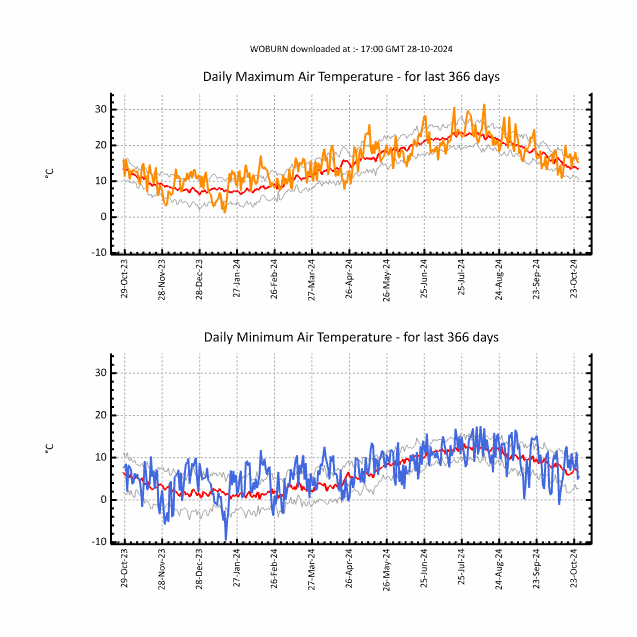 Yearly: Orange Line (maximum), Blue Line (minimum): Daily Values, °C; Red Line : 30 year mean, 1991 to 2020; Grey Line : +/- one standard deviation representing the variability of the data used to calculate the thirty year mean.
Wind Vectors
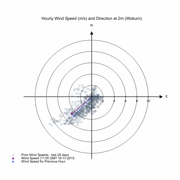 Monthly: For weekly and monthly charts of wind vectors the most recent and penultimate wind speed and direction records are indicated by the purple and blue arrows, respectively. The arrows indicate the direction (°) from which the wind comes from. Earlier records are displayed using open circles. Data points are the average wind speed (m/s) for a given direction (averaged) over a one-hour period. The x- and y- axes represent wind direction and the distance of each point from the origin represents wind speed (concentric circles denote the wind speed intervals, m/s).
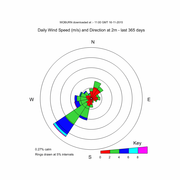 Yearly: Annual wind data are summarised on a rose diagram showing the distribution of winds according to their speed (m/s) and direction (°). Wind records are grouped by direction into 22.5° circular segments each with radius (length) corresponding to the number of wind records in the segment (expressed as a percentage of the 365 daily observations represented). Wind speeds are categorised according to the 'Key' (lower right-hand scale) and the proportion of all records of each speed occurring within each segment are denoted using the appropriate colours.
Rainfall
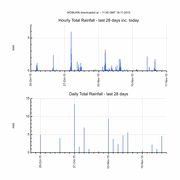 Monthly: Hourly data: total rainfall, mm, in an hour
Daily data: total rainfall, mm (09:00 to 09:00).
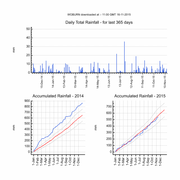 Yearly: Blue Line: Daily rainfall, mm (09:00 to 09:00) and Accumulated daily rainfall, mm ; * Red Line: accumulated daily rainfall, 30 year mean (1991 to 2020 previously 1981-2020); Grey Line : +/- one standard deviation representing the variability of the data used to calculate the thirty year mean.
* The thirty year mean (1991 to 2020) for rainfall should be used only for guidance. During this period rainfall at Woburn Met Station was measured using the two different styles of rain gauge mentioned above.
Solar Radiation
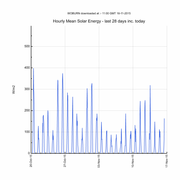 Monthly: Blue Line: hourly mean solar radiation, watts/m2.
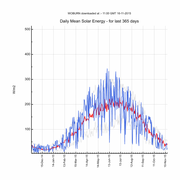 Yearly: Blue Line : Mean Daily Values, watts/m2 (00:00 to 24:00 GMT); Red Line : 30 year mean, 1991 to 2020 (previously 1981-2010); Grey Line : +/- one standard deviation representing the variability of the data used to calculate the thirty year mean.
Soil Temperature at 10cm under bare soil
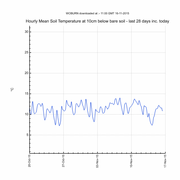 Monthly: Blue Line: hourly mean soil temperature at 10cm below bare soil.
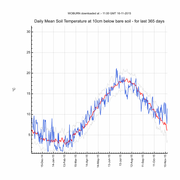 Yearly: Blue Line: Daily Values; Red Line: 30 year mean, 1991 to 2020 (previously 1981- 2010); Grey Line : +/- one standard deviation representing the variability of the data used to calculate the thirty year mean.
Soil Temperature at 30cm under grass
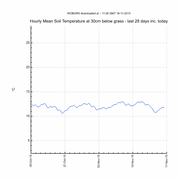 Monthly: Blue Line: hourly mean soil temperature at 30cm below grass.
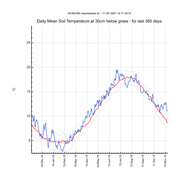 Yearly: Blue Line: Daily Values; Red Line: 30 year mean, 1991 to 2020 (previously 1981- 2010); Grey Line : +/- one standard deviation representing the variability of the data used to calculate the thirty year mean.