Climate
Weather Recording at Rothamsted
Long-term meteorological observations can be used to identify changes and trends in climate that may have a positive or negative impact on the environment.
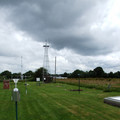
Scientists at Rothamsted have been observing aspects of the weather on a daily basis since 1853, when the first measurement of rainfall was recorded. From 1853 to 2003 these daily data were recorded manually at 09:00 at the Rothamsted Met Station. In 1993 an automated weather station (ECN AWS - site ID: ECN AWS T06 01) was installed adjacent to the Met Station to collect hourly and daily data as part of the ECN protocols for compatibilty of data across sites. In 2004 the Rothamsted Met Station was fully automated and in 2014 the ECN AWS was relocated onto the Met Station (ECN AWS - site ID: ECN AWS T06 02) using existing and new sensors. These complementary meteorological records are kept electronically within the electronic Rothamsted Archive (e-RA) and the ECN Data Centre.
Temperature
 The Rothamsted meteorological data (Figure 1) show that the annual mean air temperature has fluctuated considerably between 1878 and 2012. However, when the variation in annual temperature is smoothed using five year means (below) it is apparent that air temperatures have risen sharply from 1987 to 2007, but over the last five years temperatures have become more variable than in the previous twenty-one years, with annual mean temperatures ranging from 9.01°C in 2010 to 10.82°C in 2011.
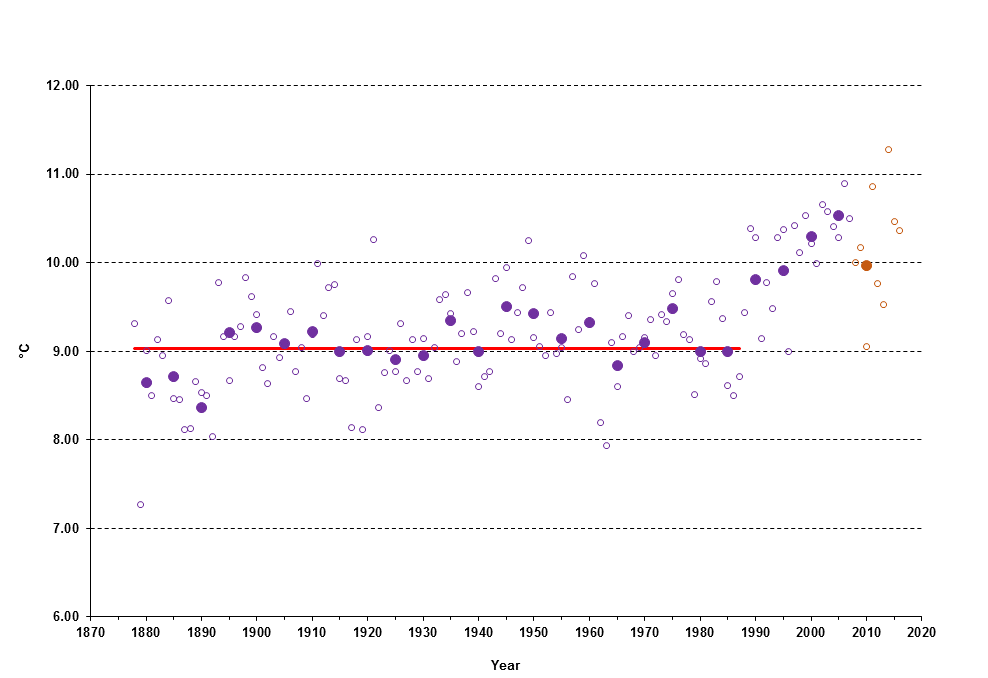
Figure 1. Annual mean air temperature (o) has increased year on year (1987 to 2007). The 5 year means (•) show that by the year 2000 the mean air temperature was approximately 1°C higher than the long-term mean (—, 1878 to 1987). However in recent years annual air temperatures (o) have started to become more variable. This is reflected in the latest 5 year mean (•) which shows a decrease in temperature.
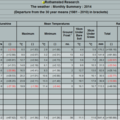
The seasonal mean air temperatures (Table 1) indicate that the warmest Spring (10.4°C, 2011), Summer (17.8°C, 2003), Autumn (12.8°C, 2006) and Winter (6.19°C, 2007) at Rothamsted have all been recorded in the last decade. The warmest year on record was 2006, with an annual mean air temperature (January to December) of 10.84 °C. Daily air temperatures are considerably more variable; the highest temperature recorded at Rothamsted was 35.6°C in August 2003.The lowest temperature recorded was -17.0°C in December 1981; even lower than the -16.7°C recorded in January 1963.
Table 1. Seasonal Mean Air Temperatures |
|||||
|
|
Winter (Dec-Feb) |
Spring (Mar-May) |
Summer (Jun-Aug) |
Autumn (Sep-Nov) |
Year (Jan-Dec) |
|
Warmest |
6.19 |
10.40 |
17.78 |
12.84 |
10.84 |
|
Coldest |
-1.41 |
6.24 |
13.60 |
7.45 |
7.27 |
|
Year (Warmest) |
2007 |
2011 |
2003 |
2006 |
2006 |
|
Year (Coldest) |
1963 |
1887 |
1922 |
1919 |
1879 |
Rainfall
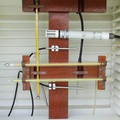
 Annual mean rainfall data mentioned in the following text comprises data from the 5” manual rain gauge (1853 to 2003) and the ECN AWS tipping bucket rain gauge (2004 to 2012). Both gauges are cylindrical in shape.
At Rothamsted the annual 30-year mean (1981 to 2010) for rainfall is 718.4mm. The annual rainfall (Table 2) for 2012 (978.4) was 36% greater than the 30-year mean, with total rainfall in April (154.2mm) and June (159.4mm) reaching 183% and 205% of the 30-year mean (54.5mm and 52.2mm) respectively. Paradoxically, both the driest (2007) and wettest (2012) April on record at Rothamsted were recorded in recent years; only 6 years apart.
Table 2. Seasonal and Annual Rainfall |
|||||
|
Winter (Dec-Feb) |
Spring (Mar-May) |
Summer (Jun-Aug) |
Autumn (Sep-Nov) |
Year (Jan-Dec) |
|
|
Wettest |
393.6 |
329.9 |
409.9 |
396.0 |
978.4 |
|
Driest |
61.8 |
36.0 |
34.2 |
56.4 |
380.1 |
|
Year (Wettest) |
1915 |
1979 |
1879 |
2000 |
2012 |
|
Year (Driest) |
1992 |
2011 |
1921 |
1978 |
1921 |
The total annual rainfall at Rothamsted in 2012 exceeds the previous records of 2000 (973.2mm) and 1903 (948.8mm). The national water providers declared a drought at the end of March 2012 after two years of below average rainfall; the spring of 2011 was the driest on record with only 36.0mm for the months of March, April and May. Reservoir and aquifer levels had fallen to unsustainable levels by spring 2012. However, heavy rain fell across the UK in April, June and July 2012 with April and June being the wettest on record at Rothamsted. Total rainfall during these months was 154.2mm and 159.4mm respectively.
A comparison of temperature and rainfall across the twelve terrestrial ECN sites, since records began in 1992, shows Rothamsted is the 2nd driest ECN site, with a mean monthly rainfall total of only 57.2mm, slightly more than Drayton’s 54.4mm. Rothamsted is the 3rd warmest site, with an average monthly air temperature of 10.2°C, slightly less than Alice Holt (10.7°C) and Drayton (10.3°C). These sites are in the south central/south eastern part of England, so it is perhaps not surprising that they have greater mean temperatures than the more northernly ECN sites.
* Why use a 30 year mean? The following extract was taken from the Met Office web-pages explaining why the long-term mean is averaged over a period of thirty years - "The World Meteorological Organization (WMO) requires the calculation of averages for consecutive periods of 30 years, with the latest covering the 1961-1990 period. However, many WMO members, including the UK, update their averages at the completion of each decade. Thirty years was chosen as a period long enough to eliminate year-to-year variations." Therefore, unless stated, we use the current thirty year mean (1981 to 2010). (REVISED 01/01/2011 previously 1971-2000)
Click on an image for a full size version and slideshow


Weather Charts
 Today's Weather and other related charts.