Yearly Rainfall
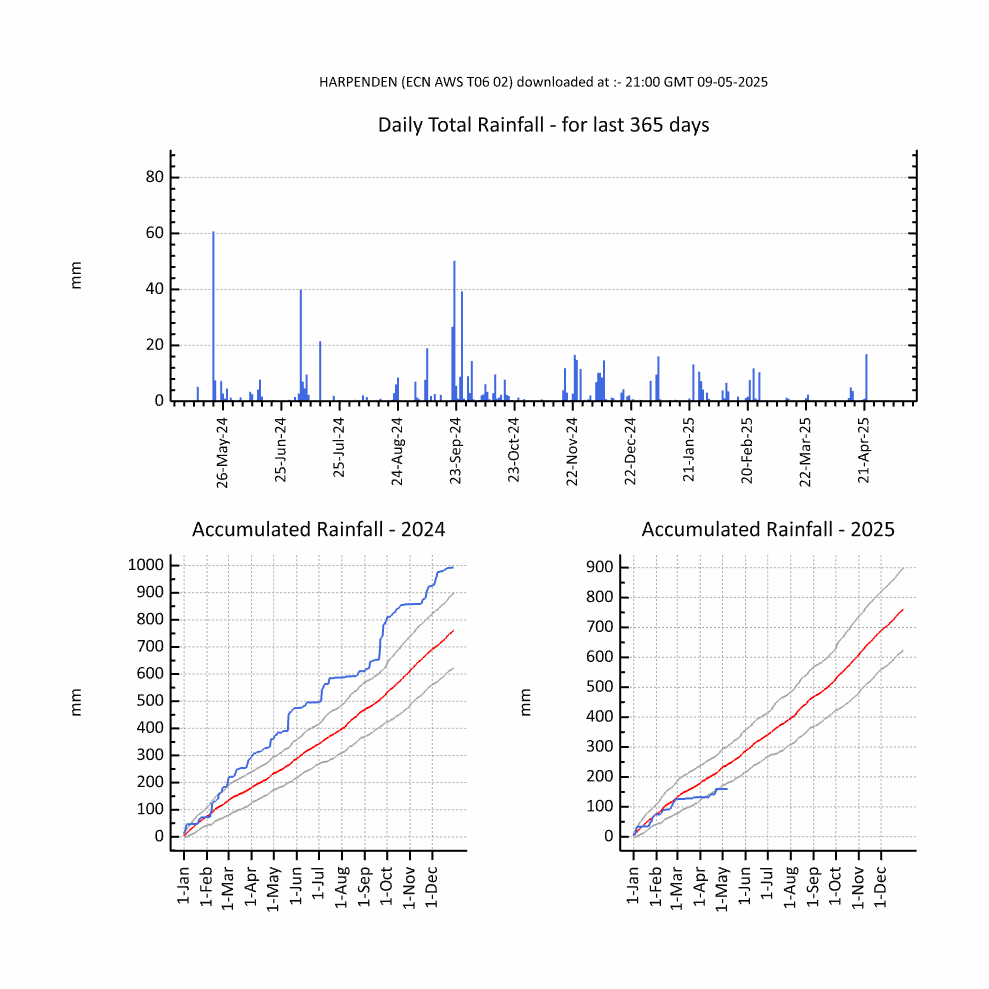
Blue Line: Daily rainfall (09:00 to 09:00) and Accumulated daily rainfall ; * Red Line: accumulated daily rainfall, 30 year mean (1981 to 2010 previously 1971-2000); Grey Line : +/- one standard deviation representing the variability of the data used to calculate the thirty year mean.
* The thirty year mean (1981 to 2010) for rainfall should be used only for guidance. This is due to the fact that rainfall measured during this period was two different rain gauges (see main Rothamsted Weather page).