Yearly Soil Temperature at 10cm
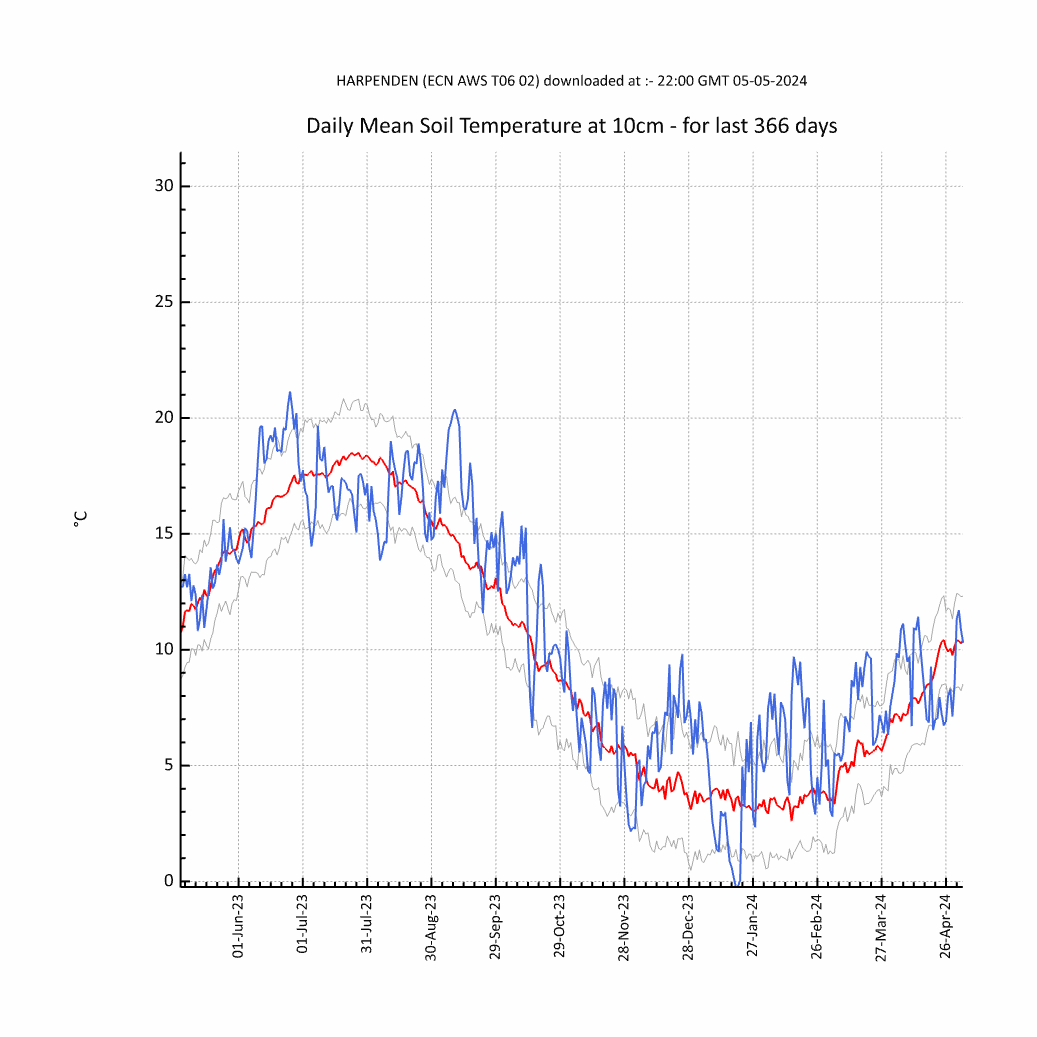
Blue Line : Daily mean soil temperatures at 10cm below bare soil; Red Line : 30 year mean, 1981 to 2010 (previously 1971-2000); Grey Line : +/- one standard deviation representing the variability of the data used to calculate the thirty year mean.