1. Live Catchment Data Trends (last 30 days)
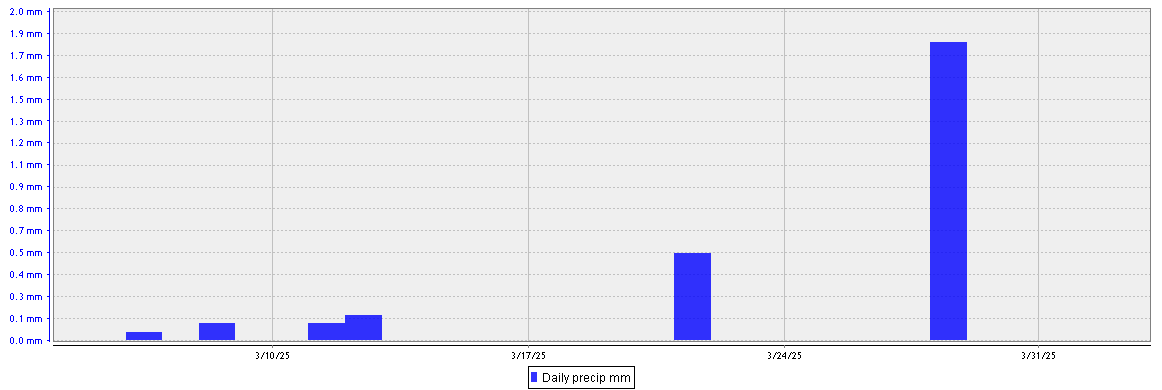
Daily precipitation
|
 |
Mean Soil and Air Temperature
|
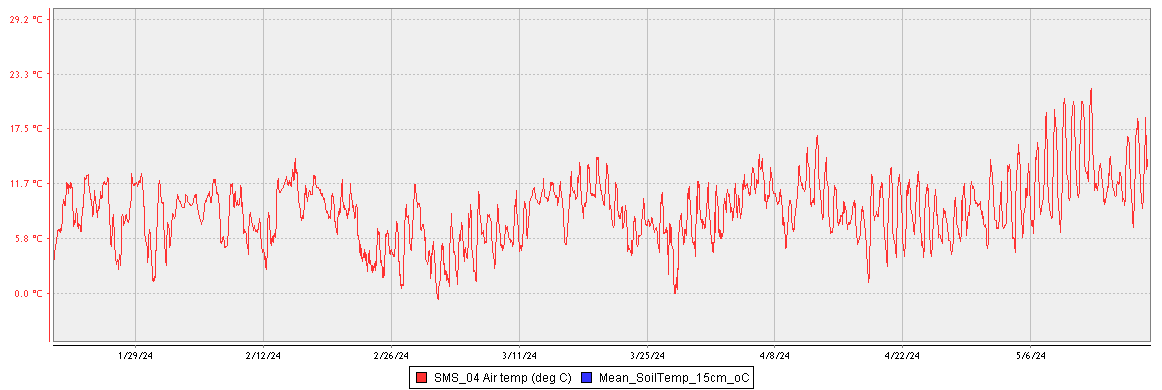 |
| Blue: Mean soil temperature (deg C) from 15 sensors at 15cm Red: Air temperature (deg C) at Met Station |
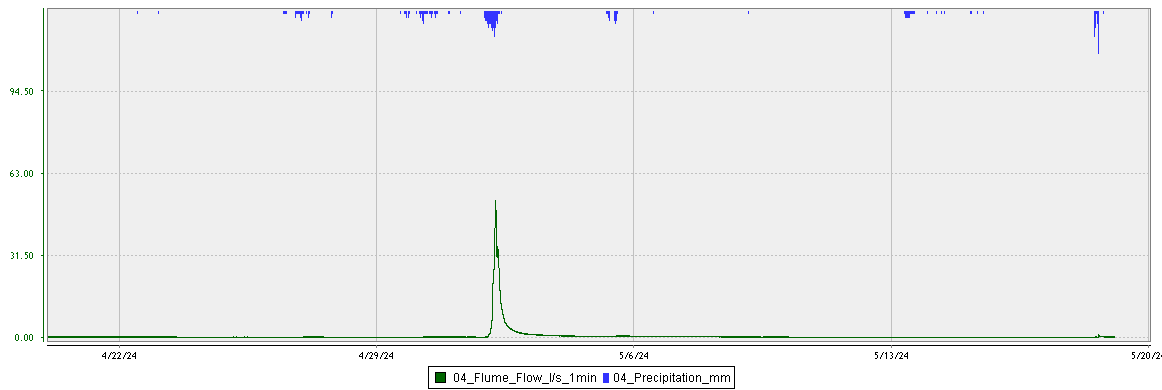
Flow & Precipitation (largest catchment on each farmlet)
Red Farmlet (Catchment 2)
|
 |
| Line: Flow (litres/sec) Bars: Precipitation |
Green Farmlet (Catchment 4)
|
 |
| Line: Flow (litres/sec) Bars: Precipitation |
Blue Farmlet (Catchment 9)
|
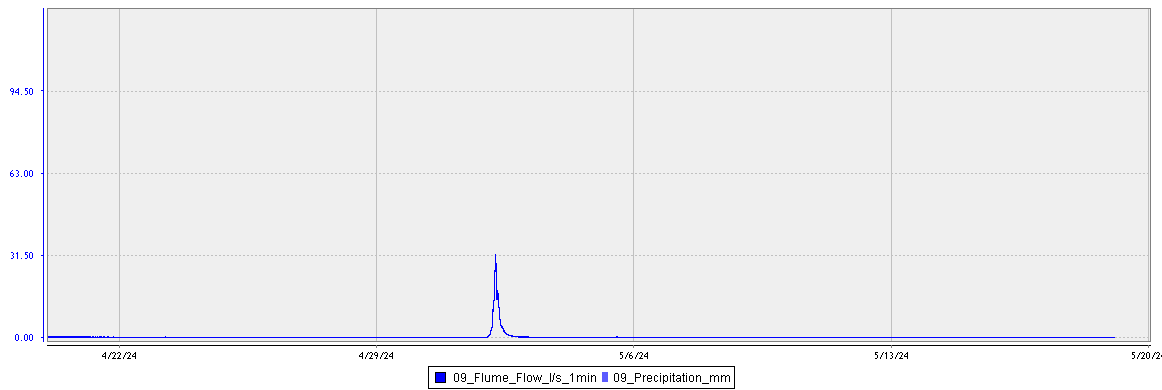 |
| Line: Flow (litres/sec) Bars: Precipitation |
2. Live Met data
This interactive tool displays live meterological data from the Farm Platform's dedicated automatic weather station and allows users to plot trends over time