Monthly Solar Radiation
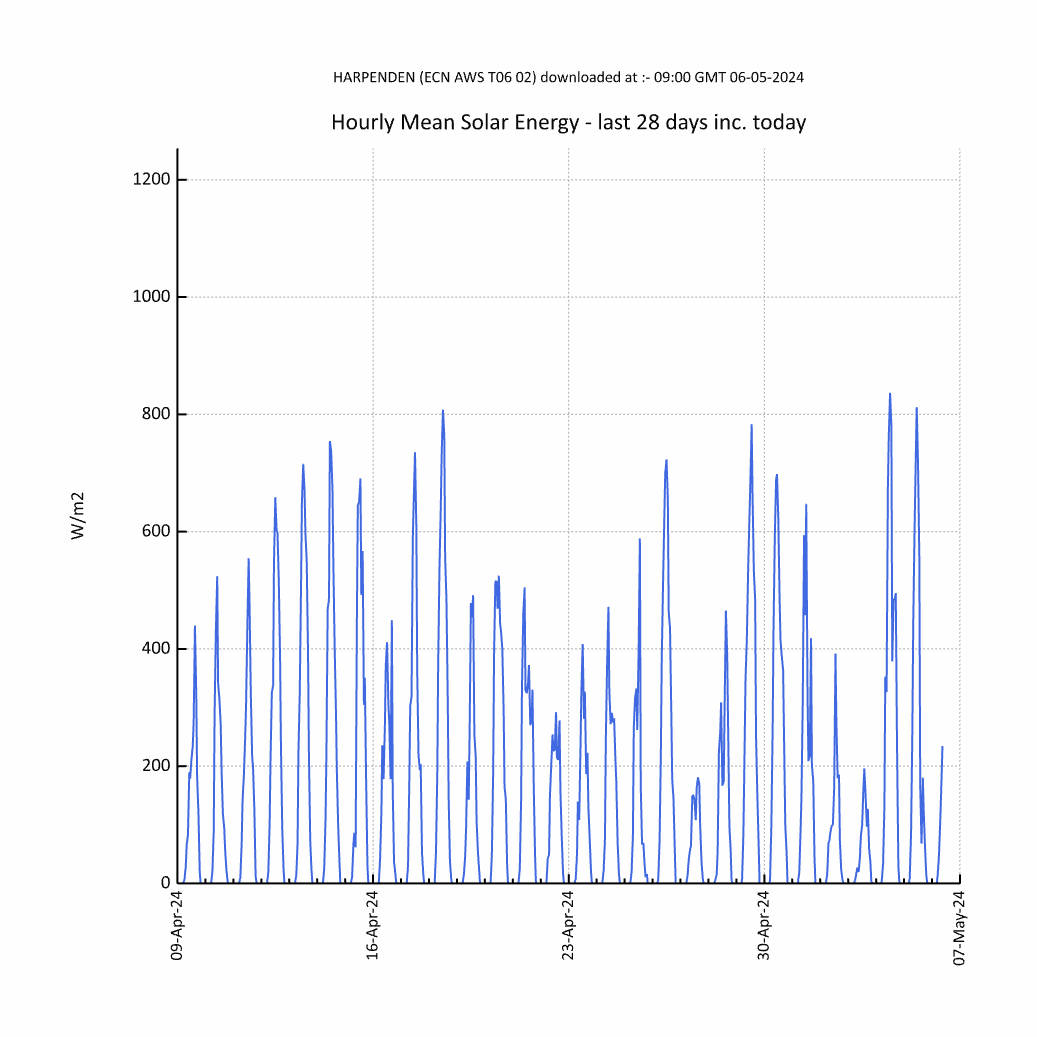
Blue Line : hourly mean solar radiation.
Blue Line : hourly mean solar radiation.
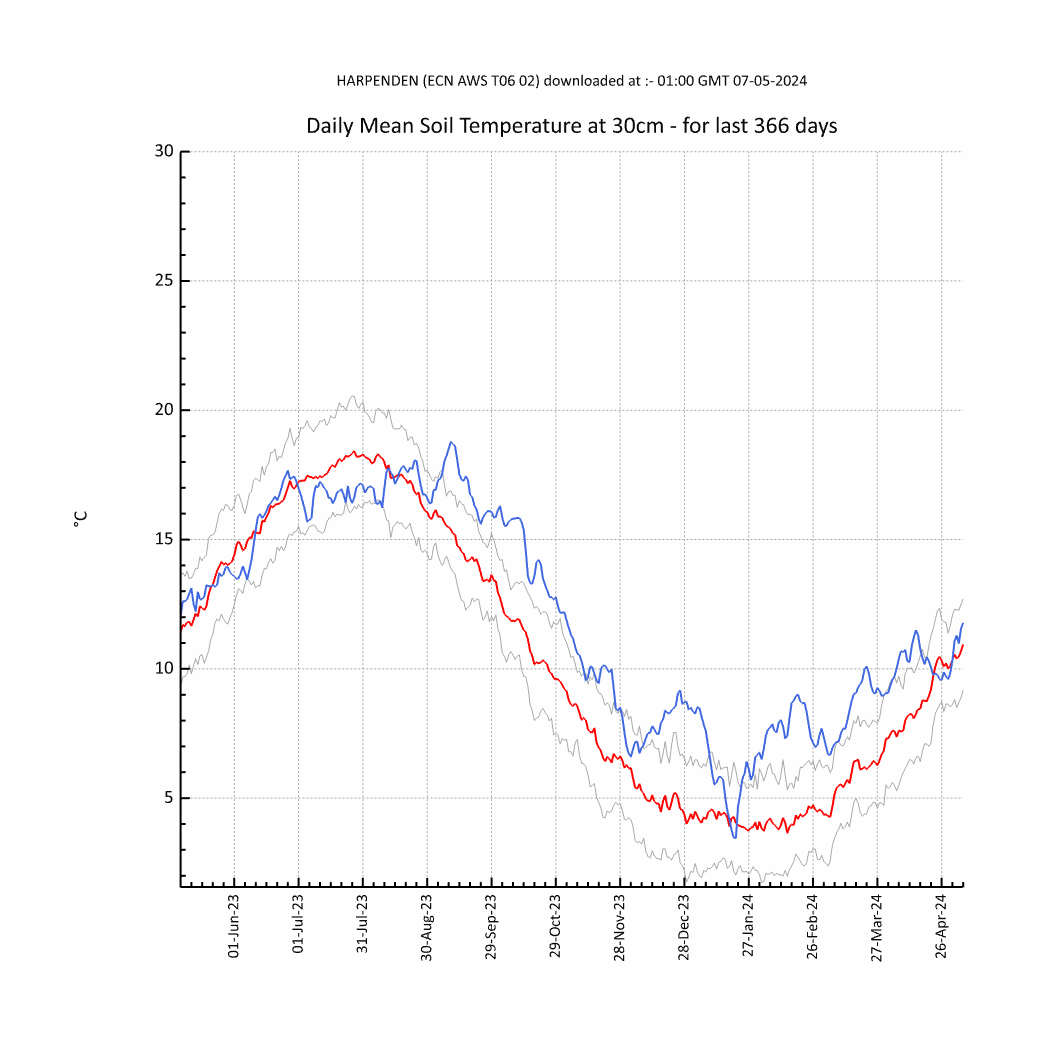
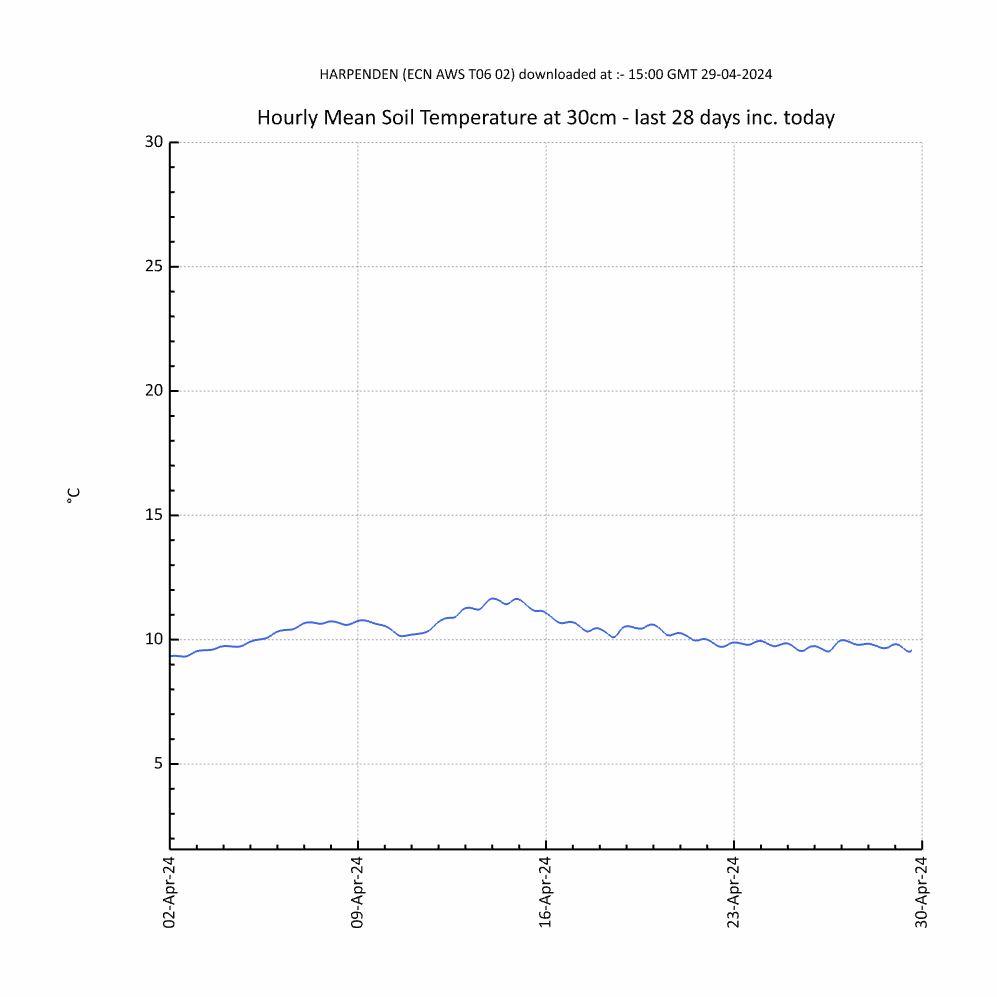
Blue Line: hourly mean soil temperature at 30cm below grass.
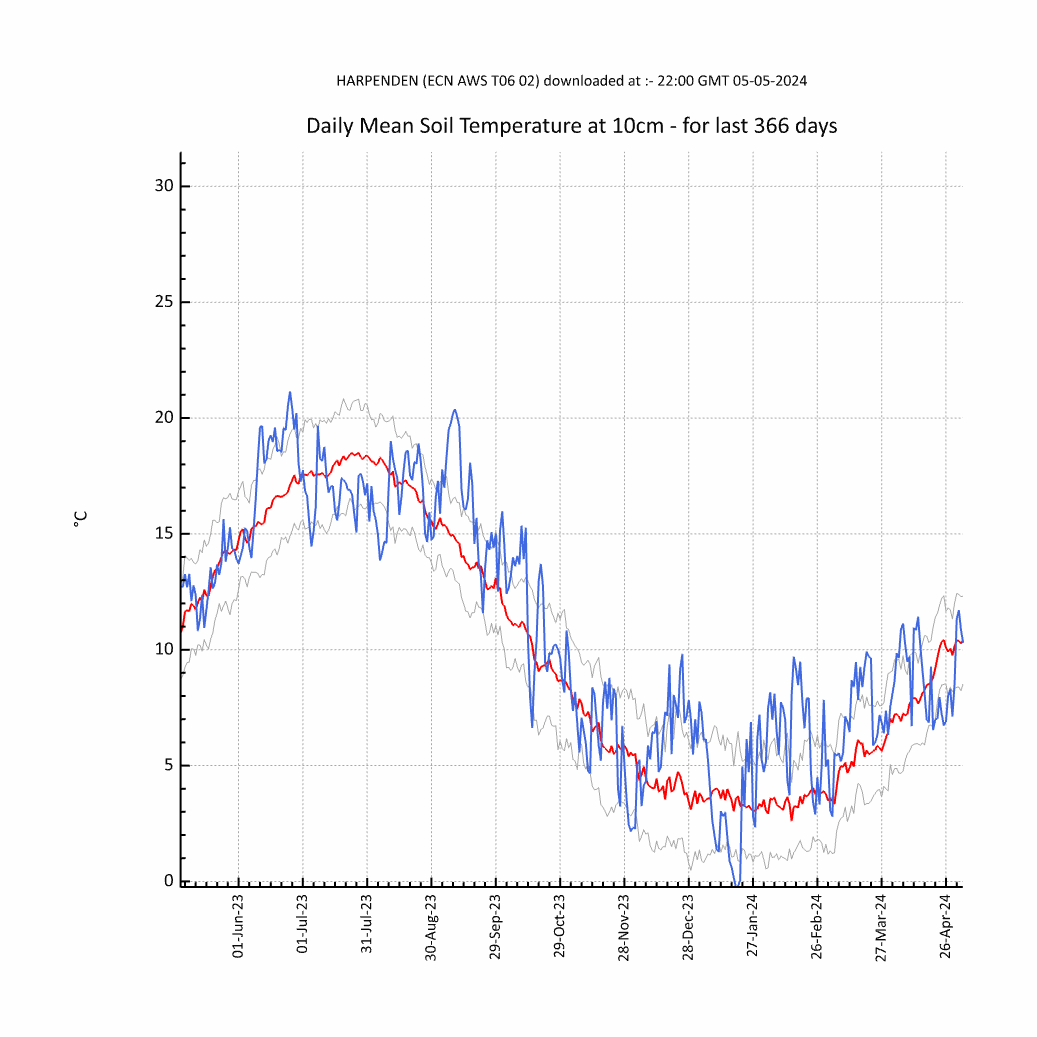
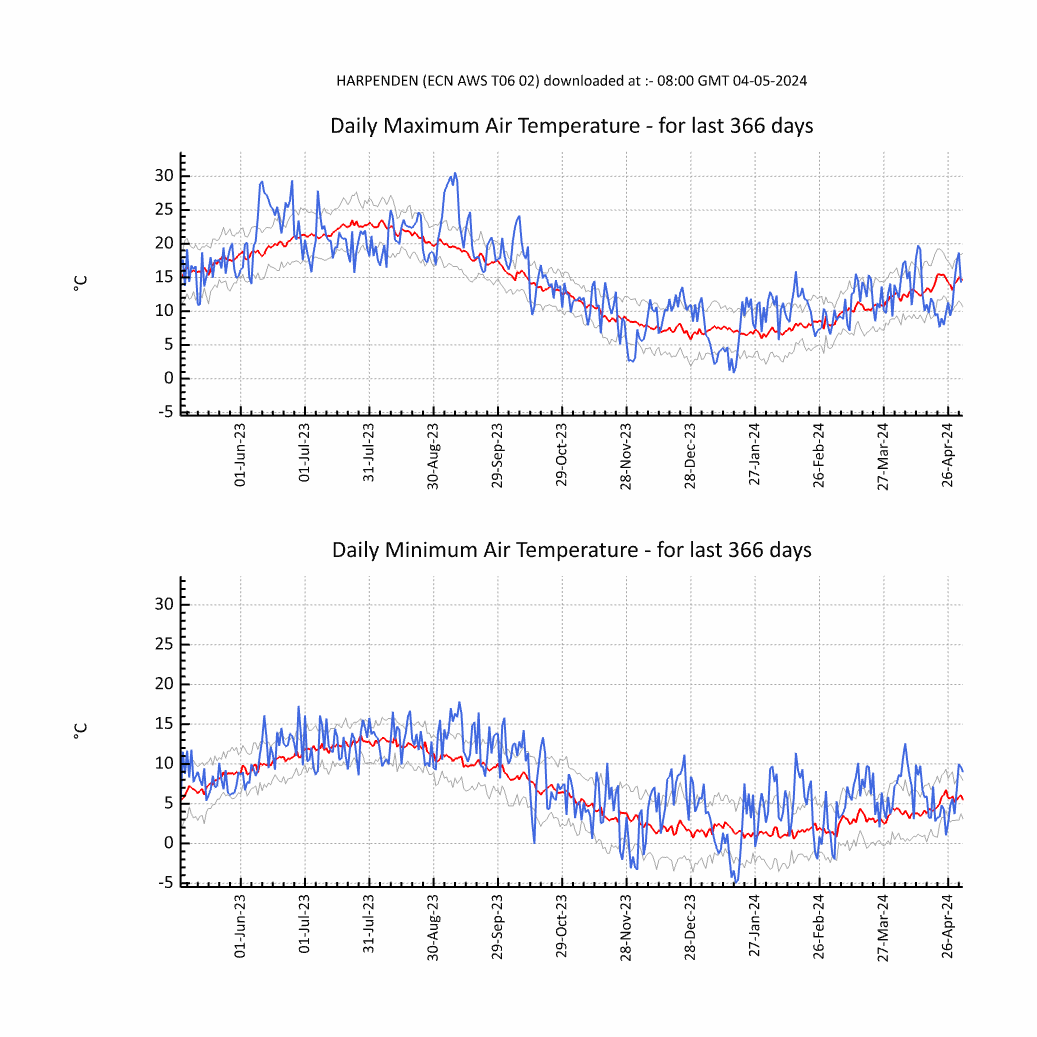
Blue Line : Daily mean soil temperatures at 10cm below bare soil; Red Line : 30 year mean, 1981 to 2010 (previously 1971-2000); Grey Line : +/- one standard deviation representing the variability of the data used to calculate the thirty year mean.
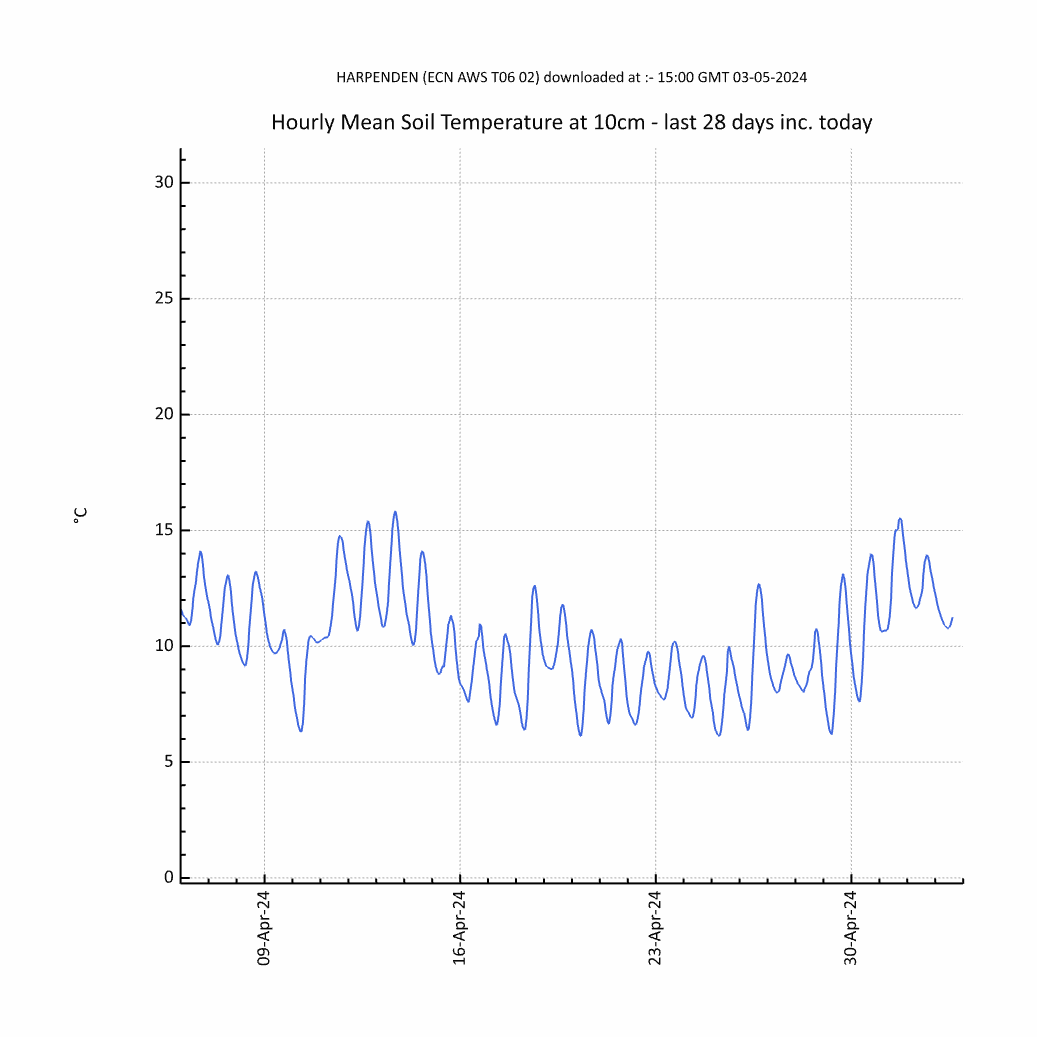
Blue Line: hourly mean soil temperature at 10cm below bare soil.
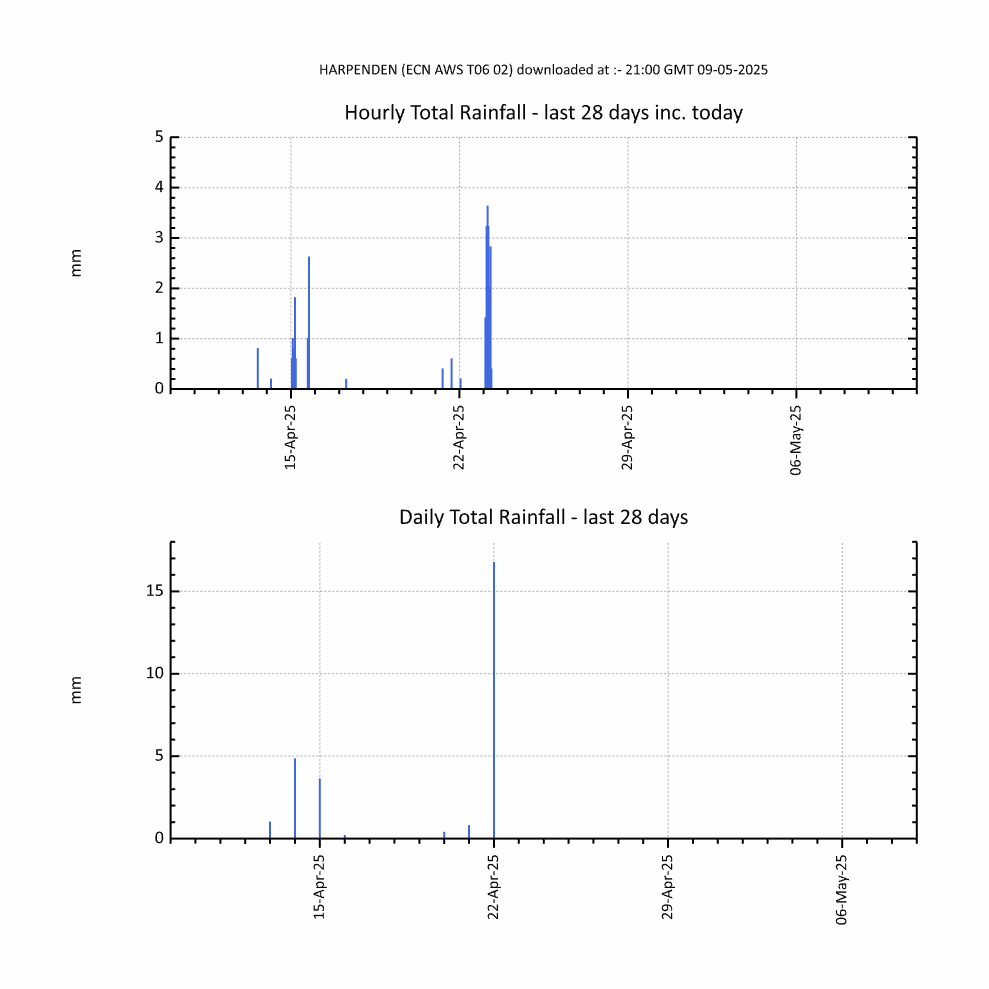
Hourly data: total rainfall in an hour
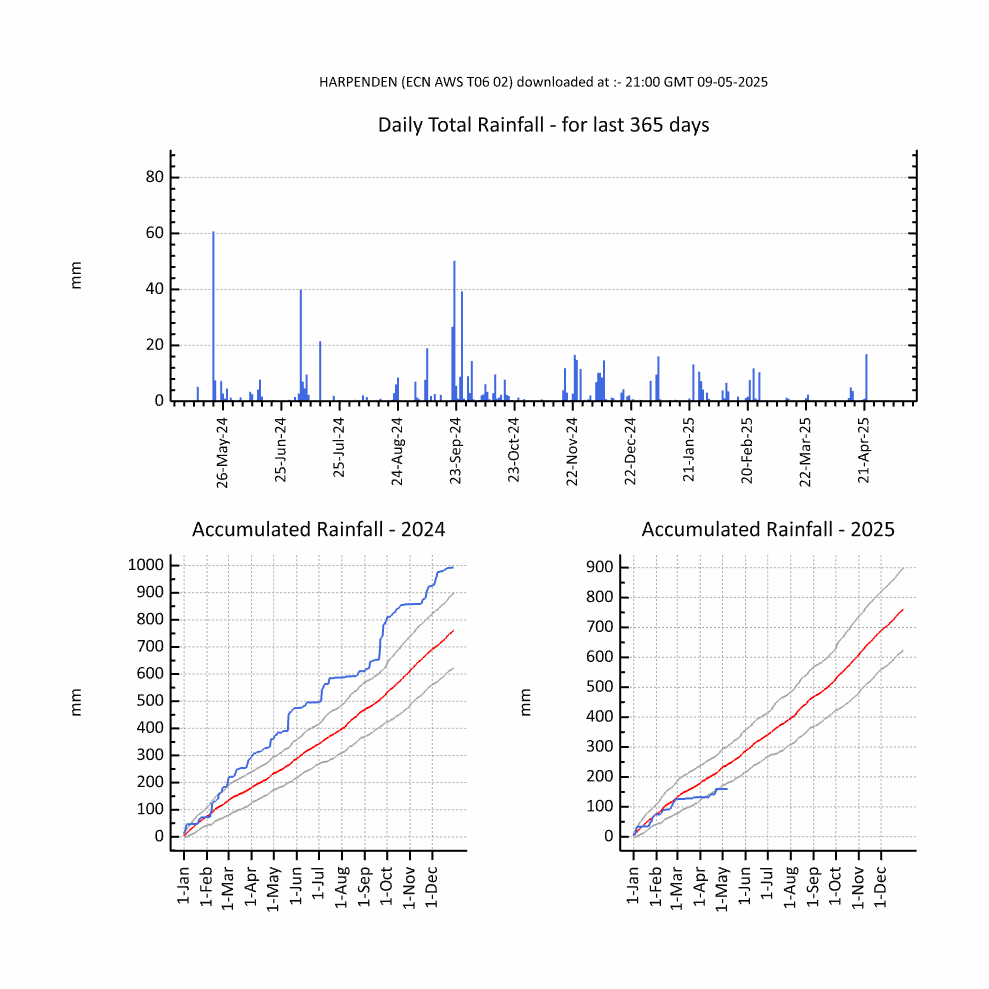
Daily data: total rainfall (09:00 to 09:00).
Measuring and recording precipitation that falls as snow